
Data visualization tools have existed for a while, but few could handle non-linear associations. Qlik's associative model lets users see what is currently existing and non-existing, uncovering business possibilities for financial institutions, it shares in a conversation with finews.asia.
In a normal database, the search results only show you what you search for based on equal or equivalent association. For example, one will get a list of sales staff serving platinum clients, after putting in a query.
In a Qlik database, however, one can see the actual search results as well as the grey portions – those not equal to your results. In the above case, it is a list of sales staff not serving platinum clients in the current month. Therein lies the business opportunity.
«The power of grey is the place where you want to ask more questions,» said Simon Kirby, Qlik’s director of Industry Solutions, Financial Services, in an interview with finews.asia.
Banks Supporting End Clients
The firm, which counts HSBC, OCBC and Citigroup as its customers, says that an increasing number of its financial services customers are now providing such data and analytics capabilities to their end customers, partners, and suppliers.
«It’s very impressive to see one of the world’s leading banks, using data and analytics to provide their customers with new and valuable services,» Kirby added.
Dynamic Collaboration
Besides providing clients with real-time data and dashboards, enabling dynamic collaboration between bankers and clients is essential in today's environment, noted Kirby. At HSBC, bank staff uses data and dashboards powered by Qlik, allowing for quick responses between bankers and their clients.
«The third generation of Business Intelligence (BI) is all about the democratization of data. By this we mean making data and analytics available to anyone, whether inside or outside the organization,» explains Kirby.
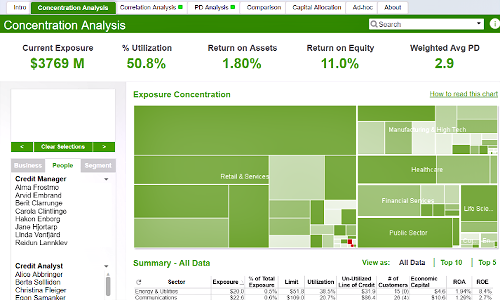
A dashboard used in risk management (Image: Qlik)
Powering Up Analysis
Apart from the common use cases for data visualization in the areas of risk management and insurance claims analysis, the Pennsylvannia-headquartered company sees increasing interest in its mapping and geo-analytics capability. Insurers typically use these to improve their underwriting metrics.
«Our customers especially love the ease with which they can combine data from multiple data sources into one app, or dashboard. Recently, our customers are showing a deep interest in our new data cataloging product as well as our ChatBot solution,» said Kirby.
Salesforce Integration
Although U.S.-based Salesforce has recently acquired its competitor Tableau, Qlik maintains a very strong relationship with the popular sales platform due to the deep integration capability of their product, said Kirby.
«We can analyze data directly from Salesforce, embed Qlik dashboards and chart directly into Salesforce pages - all through very secure governance and security layer,» he explains.
For sales managers already using Salesforce, this means finding team members with the potential to mine more platinum clients will be a breeze.